Opening the Developer tools
If you are having issues with My2N website in Chrome, open the page you are having issues on in Chrome (My2N in our example):
-
Access the Developer tools of Chrome which you can open by clicking on the 3 dots in the top right-hand corner (1) -> More tools" (2) -> Developer tools (3)
-
You can also right-click on the page and select "Inspect"
-
Alternatively you can use Ctrl+Shift+I or simply press F12 key on your keyboard

Preparing to record the logs
-
Once you have the Developer tools open go to "Network" (1) and check the "Preserve log" (2)
-
Make sure the logs are being recorded which is indicated by the red recording circle (3)

Clearing the logs
-
If you happen to click elsewhere before the test begins you can clear the log by clicking on the "Clear network log" (1) button
- Clearing the logs will not stop the recording

Recording and downloading the logs
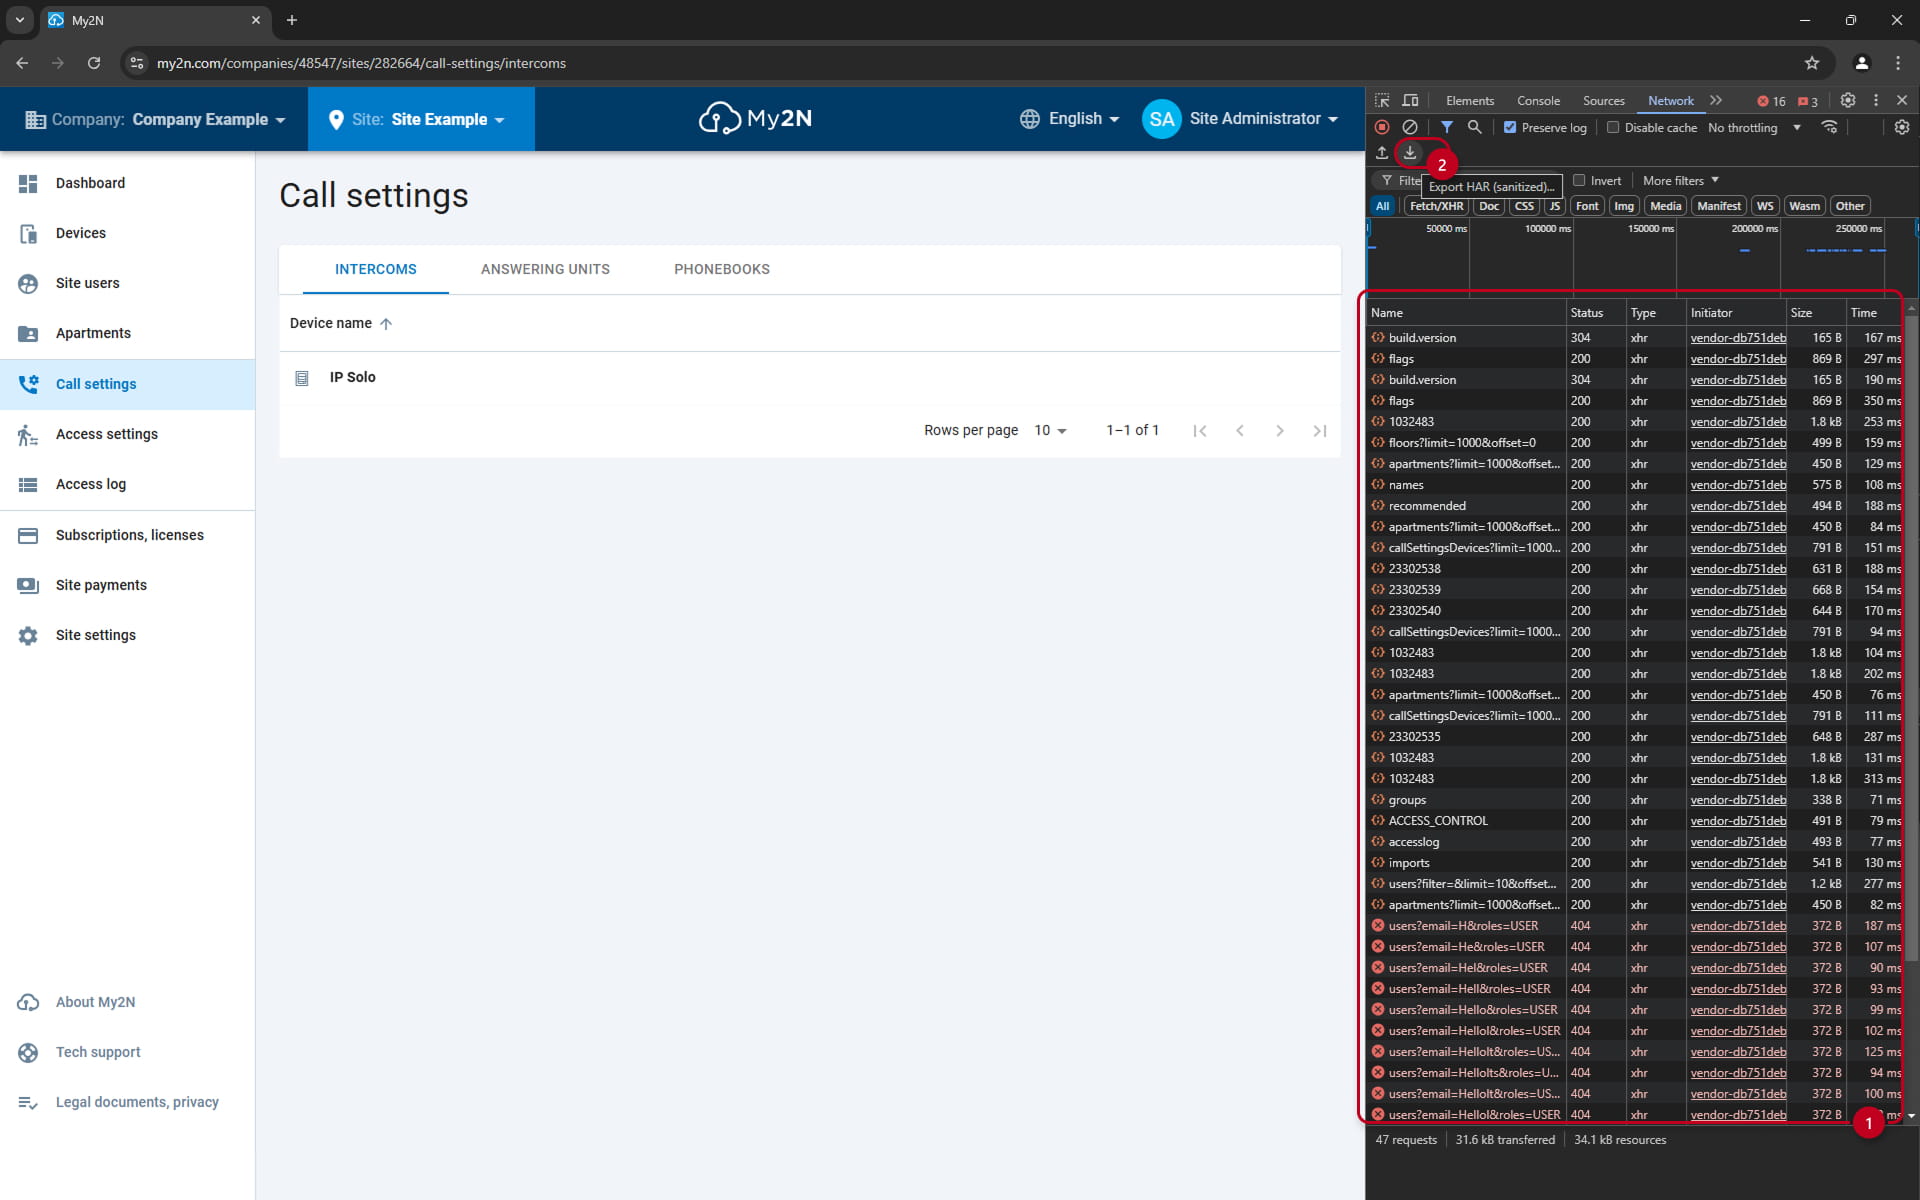
Now you are ready to start replicating the issue:-
When you click on any interactive feature on the website a log will be recorded on the right side (1)
-
Replicate the issue, step by step
-
Then download the logs by clicking on the "Export HAR" dowload button (2)
-
Downloaded HAR file can then be sent to our support for further analysis